DATA ANALYTICS / POWER BI
Customer Shopping Behavior Analysis
Understanding customer purchasing patterns, product preferences, discounts, and satisfaction through data-driven analysis.
01 / PROJECT OVERVIEW
From Raw Data to Business Insights
An end-to-end analytics project focused on transforming customer shopping records into meaningful business insights.
The project explores purchasing behavior, product category performance, customer reviews, and subscription patterns. Python and SQL support data exploration and analysis, while Power BI presents key metrics and findings in a visual format.
Business Questions
- Which product categories contribute the most to recorded purchase amounts?
- How do purchasing patterns differ across customer groups?
- What do customer ratings tell us about satisfaction?
- How many customers subscribe, and how can engagement be improved?
- Are missing values affecting the reliability of the analysis?
02 / METHODOLOGY
Project Workflow
A structured process from data preparation to business recommendations.
01. Data Source
Import customer shopping records from CSV files.
02. Data Cleaning
Inspect missing values, data types, and data quality issues.
03. Analysis
Explore purchasing patterns and customer behavior using Python and SQL.
04. Visualization
Present important metrics and patterns through Power BI visuals.
05. Recommendations
Identify opportunities for customer engagement and business improvement.
03 / DATA SNAPSHOT
Key Metrics
A snapshot of the primary customer shopping dataset.
Total Purchase Amount
$233,081
Average Purchase Amount
$59.76
Average Review Rating
3.75 / 5
Unique Customers
3,900
These figures describe the primary dataset. Confirm the currency convention before publishing the purchase amounts. Average purchase amount is not necessarily average order value, and recorded purchase amount is not necessarily accounting revenue.
04 / FINDINGS
Key Business Insights
Clothing Leads Purchase Value
Clothing contributes approximately $104,264, representing 44.7% of the total recorded purchase amount.
Clothing Has the Most Records
Clothing accounts for 1,737 records, followed by Accessories with 1,240 records.
Customer Satisfaction
The average review rating is approximately 3.75 out of 5, excluding records with missing ratings.
Missing Review Ratings
37 records have missing review ratings. These should be considered when interpreting customer satisfaction.
Subscription Patterns
The dataset contains 1,053 subscribed records and 2,847 non-subscribed records.
Compare Customer Groups Carefully
Male customer records total $157,890 in recorded purchase amount, compared with $75,191 for female customer records. These totals should be evaluated alongside group sizes and average purchase amounts.
Business Recommendations
- Review Clothing inventory and product-level demand before making stocking decisions.
- Investigate missing review ratings to improve the quality of customer satisfaction reporting.
- Compare purchasing patterns between subscribers and non-subscribers before designing engagement campaigns.
- Use average purchase amounts and customer counts alongside total amounts to make fair comparisons.
05 / TECHNOLOGY
Tools & Technologies
Tools used for data preparation, analysis, and visualization.
 Power BI
 Python
 PostgreSQL
 Pandas
 SQLAlchemy
 Matplotlib
06 / INTERACTIVE REPORT
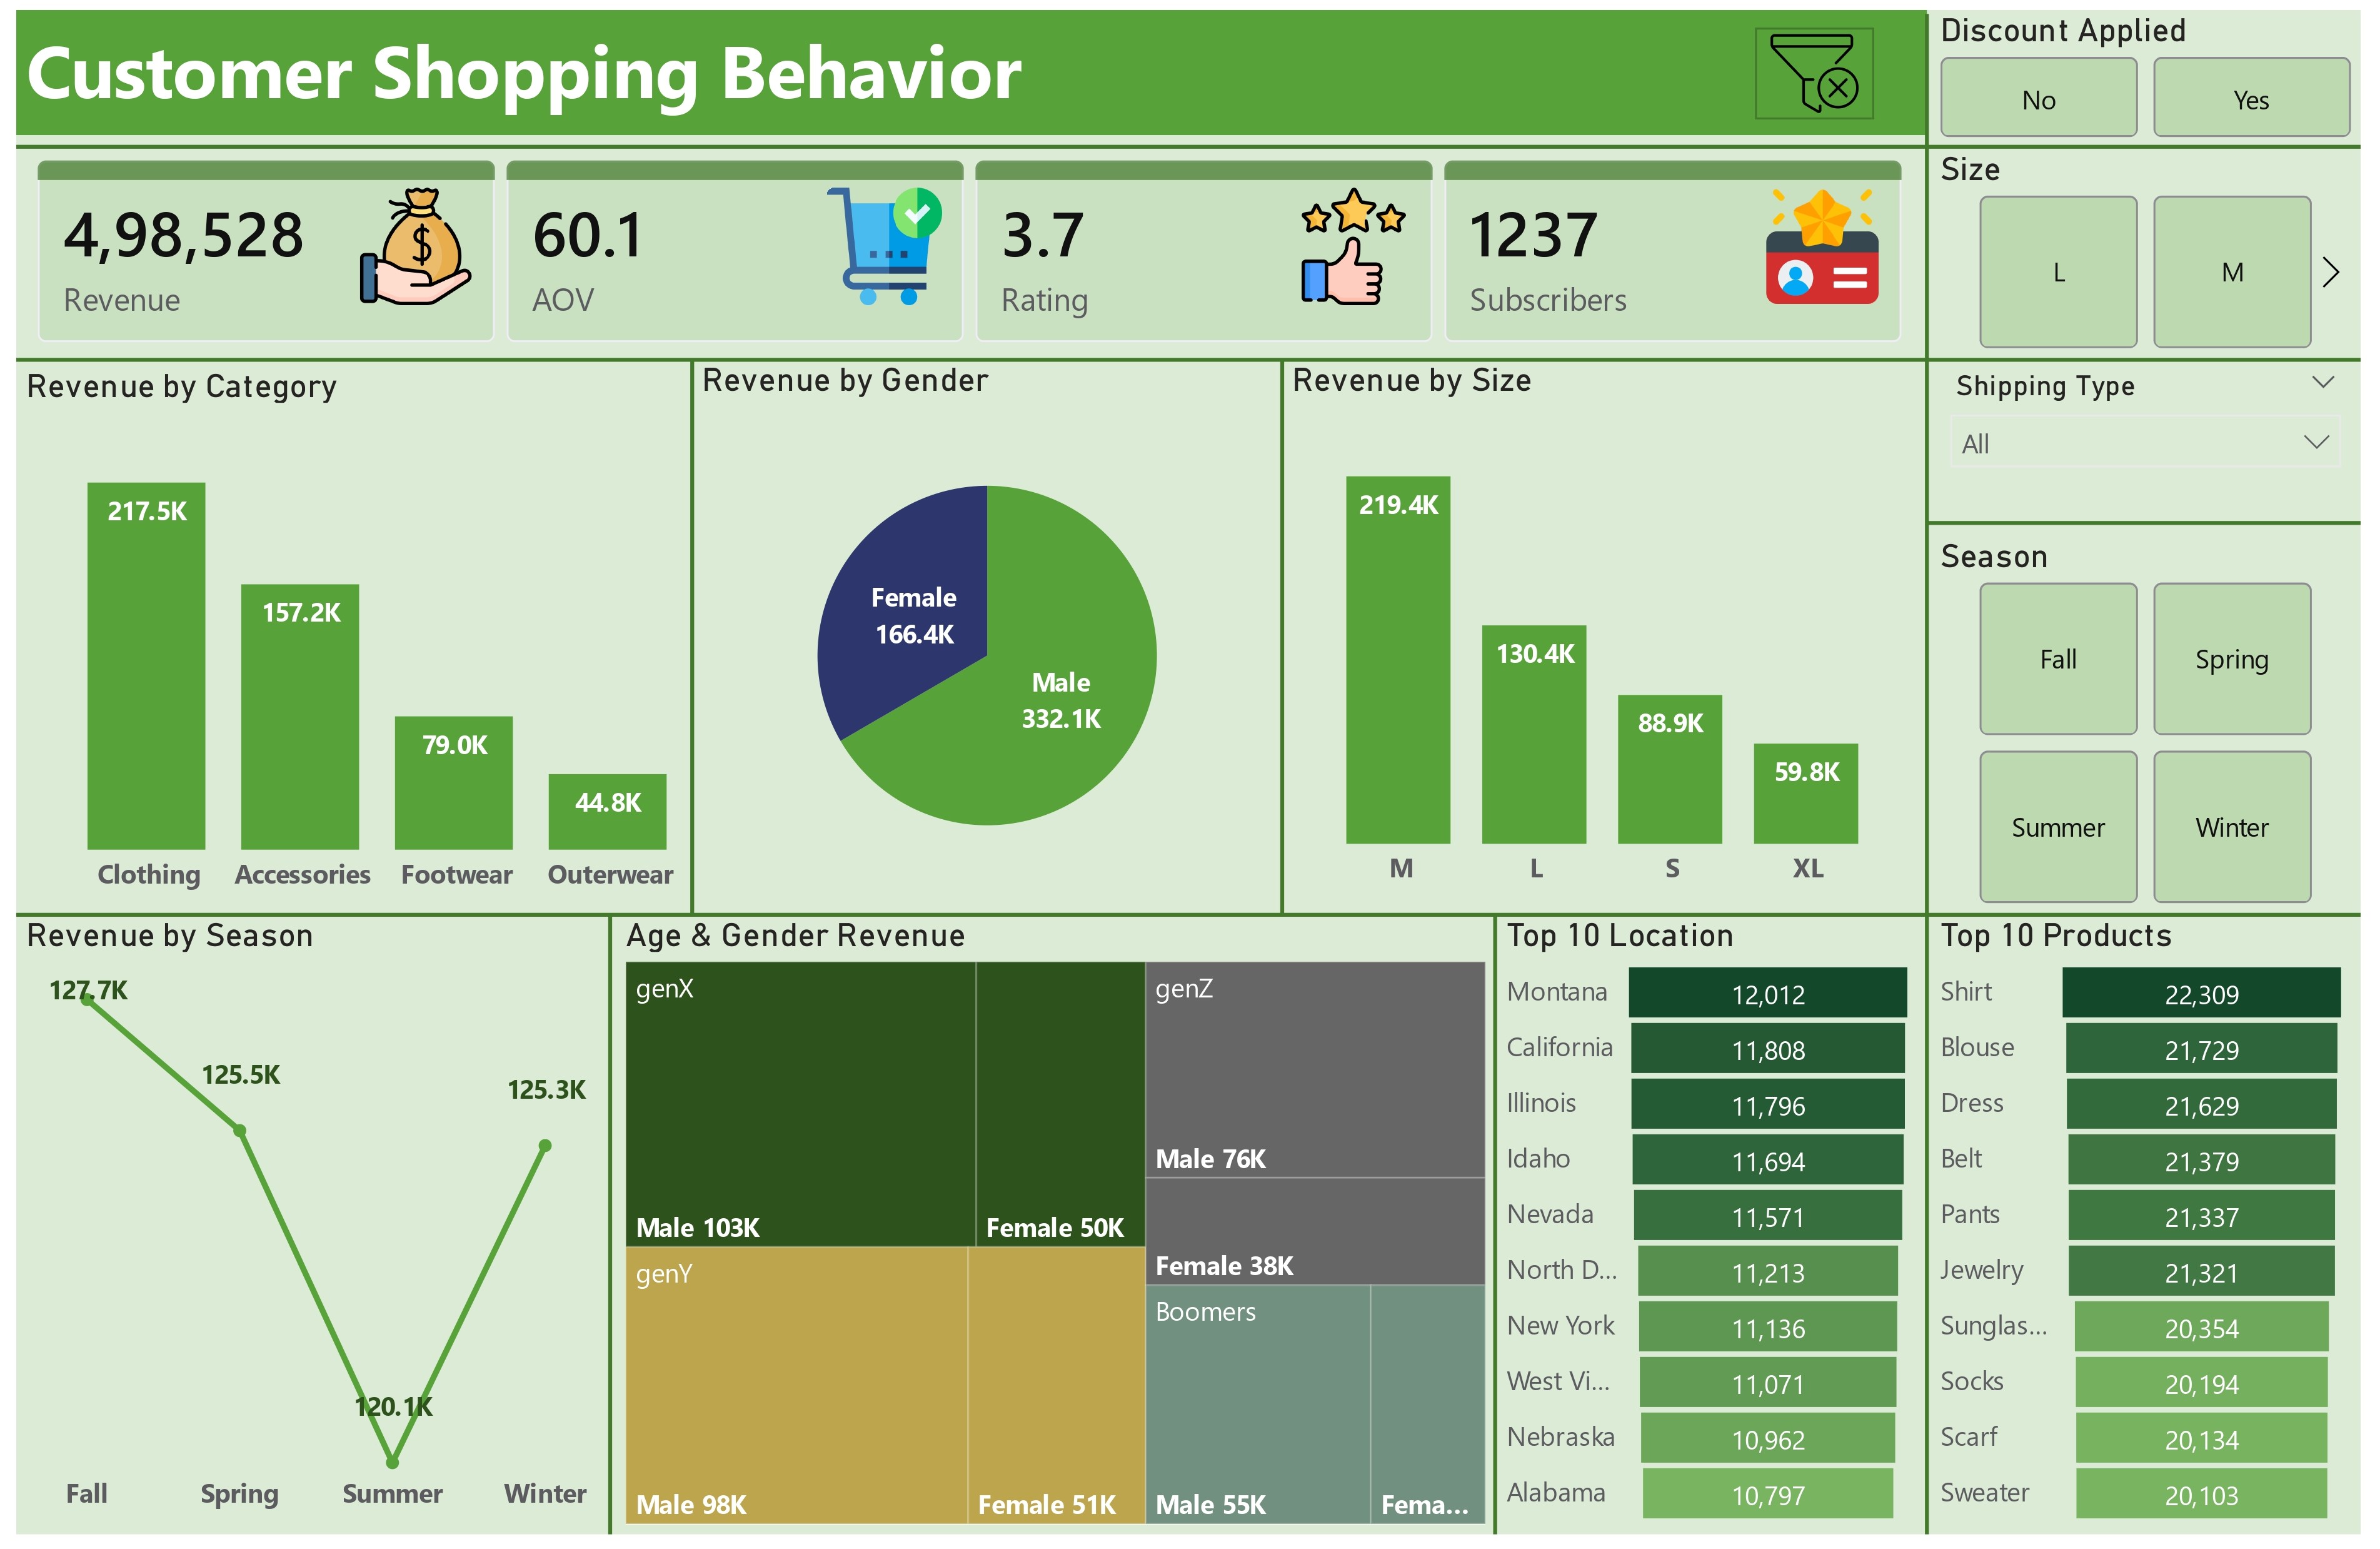
Dashboard Preview
Preview the visual report summarizing customer shopping behavior.
07 / EXPLORE THE PROJECT
Project Resources
Explore the source code and dataset used in this analysis.