Customer Shopping Behavior
Customer Shopping Behavior Analysis using Python and Power BI to Optimize Revenue, Customer Segmentation, and Inventory Planning
Project Overview
Step-by-step sales data transformation—from raw CSV files to interactive Power BI dashboards
Raw Data
CSV sales files
Data Cleaning
Data cleaning using Power Query
Transformation
Create meaningful and insightful columns
Load into Power BI
Load data into Power BI and create DAX measures for insightful visuals
Dashboard
Showcasing KPIs and insights aligned with business needs
Tools Used
 Power BI
 Python
 CSV
CSV
 PostgreSQL
 SQL Alchemy
 Matplotlib
 Pandas
Key Insights
- Strong overall performance:Total sales reached $1.20M, indicating healthy demand across outlets.
- Supermarket Type 1 dominates:It contributes the highest sales (~$787K) and item volume, making it the most profitable outlet type.
- Top-performing categories:Fruits & Vegetables and Snack Foods are the highest revenue–generating item types (≈ $0.18M each).
- Medium-sized outlets lead sales:Medium outlets generate the highest revenue (~$508K), outperforming small and large formats.
- Tier 3 locations perform best:Tier 3 outlets record the highest sales (472K), showing strong demand beyond metro areas.
- Consistent customer satisfaction:Average rating remains stable at 4.0 across all outlet types.
- Low-fat products outperform:Low-fat items contribute more sales than regular items, reflecting a shift toward healthier choices.
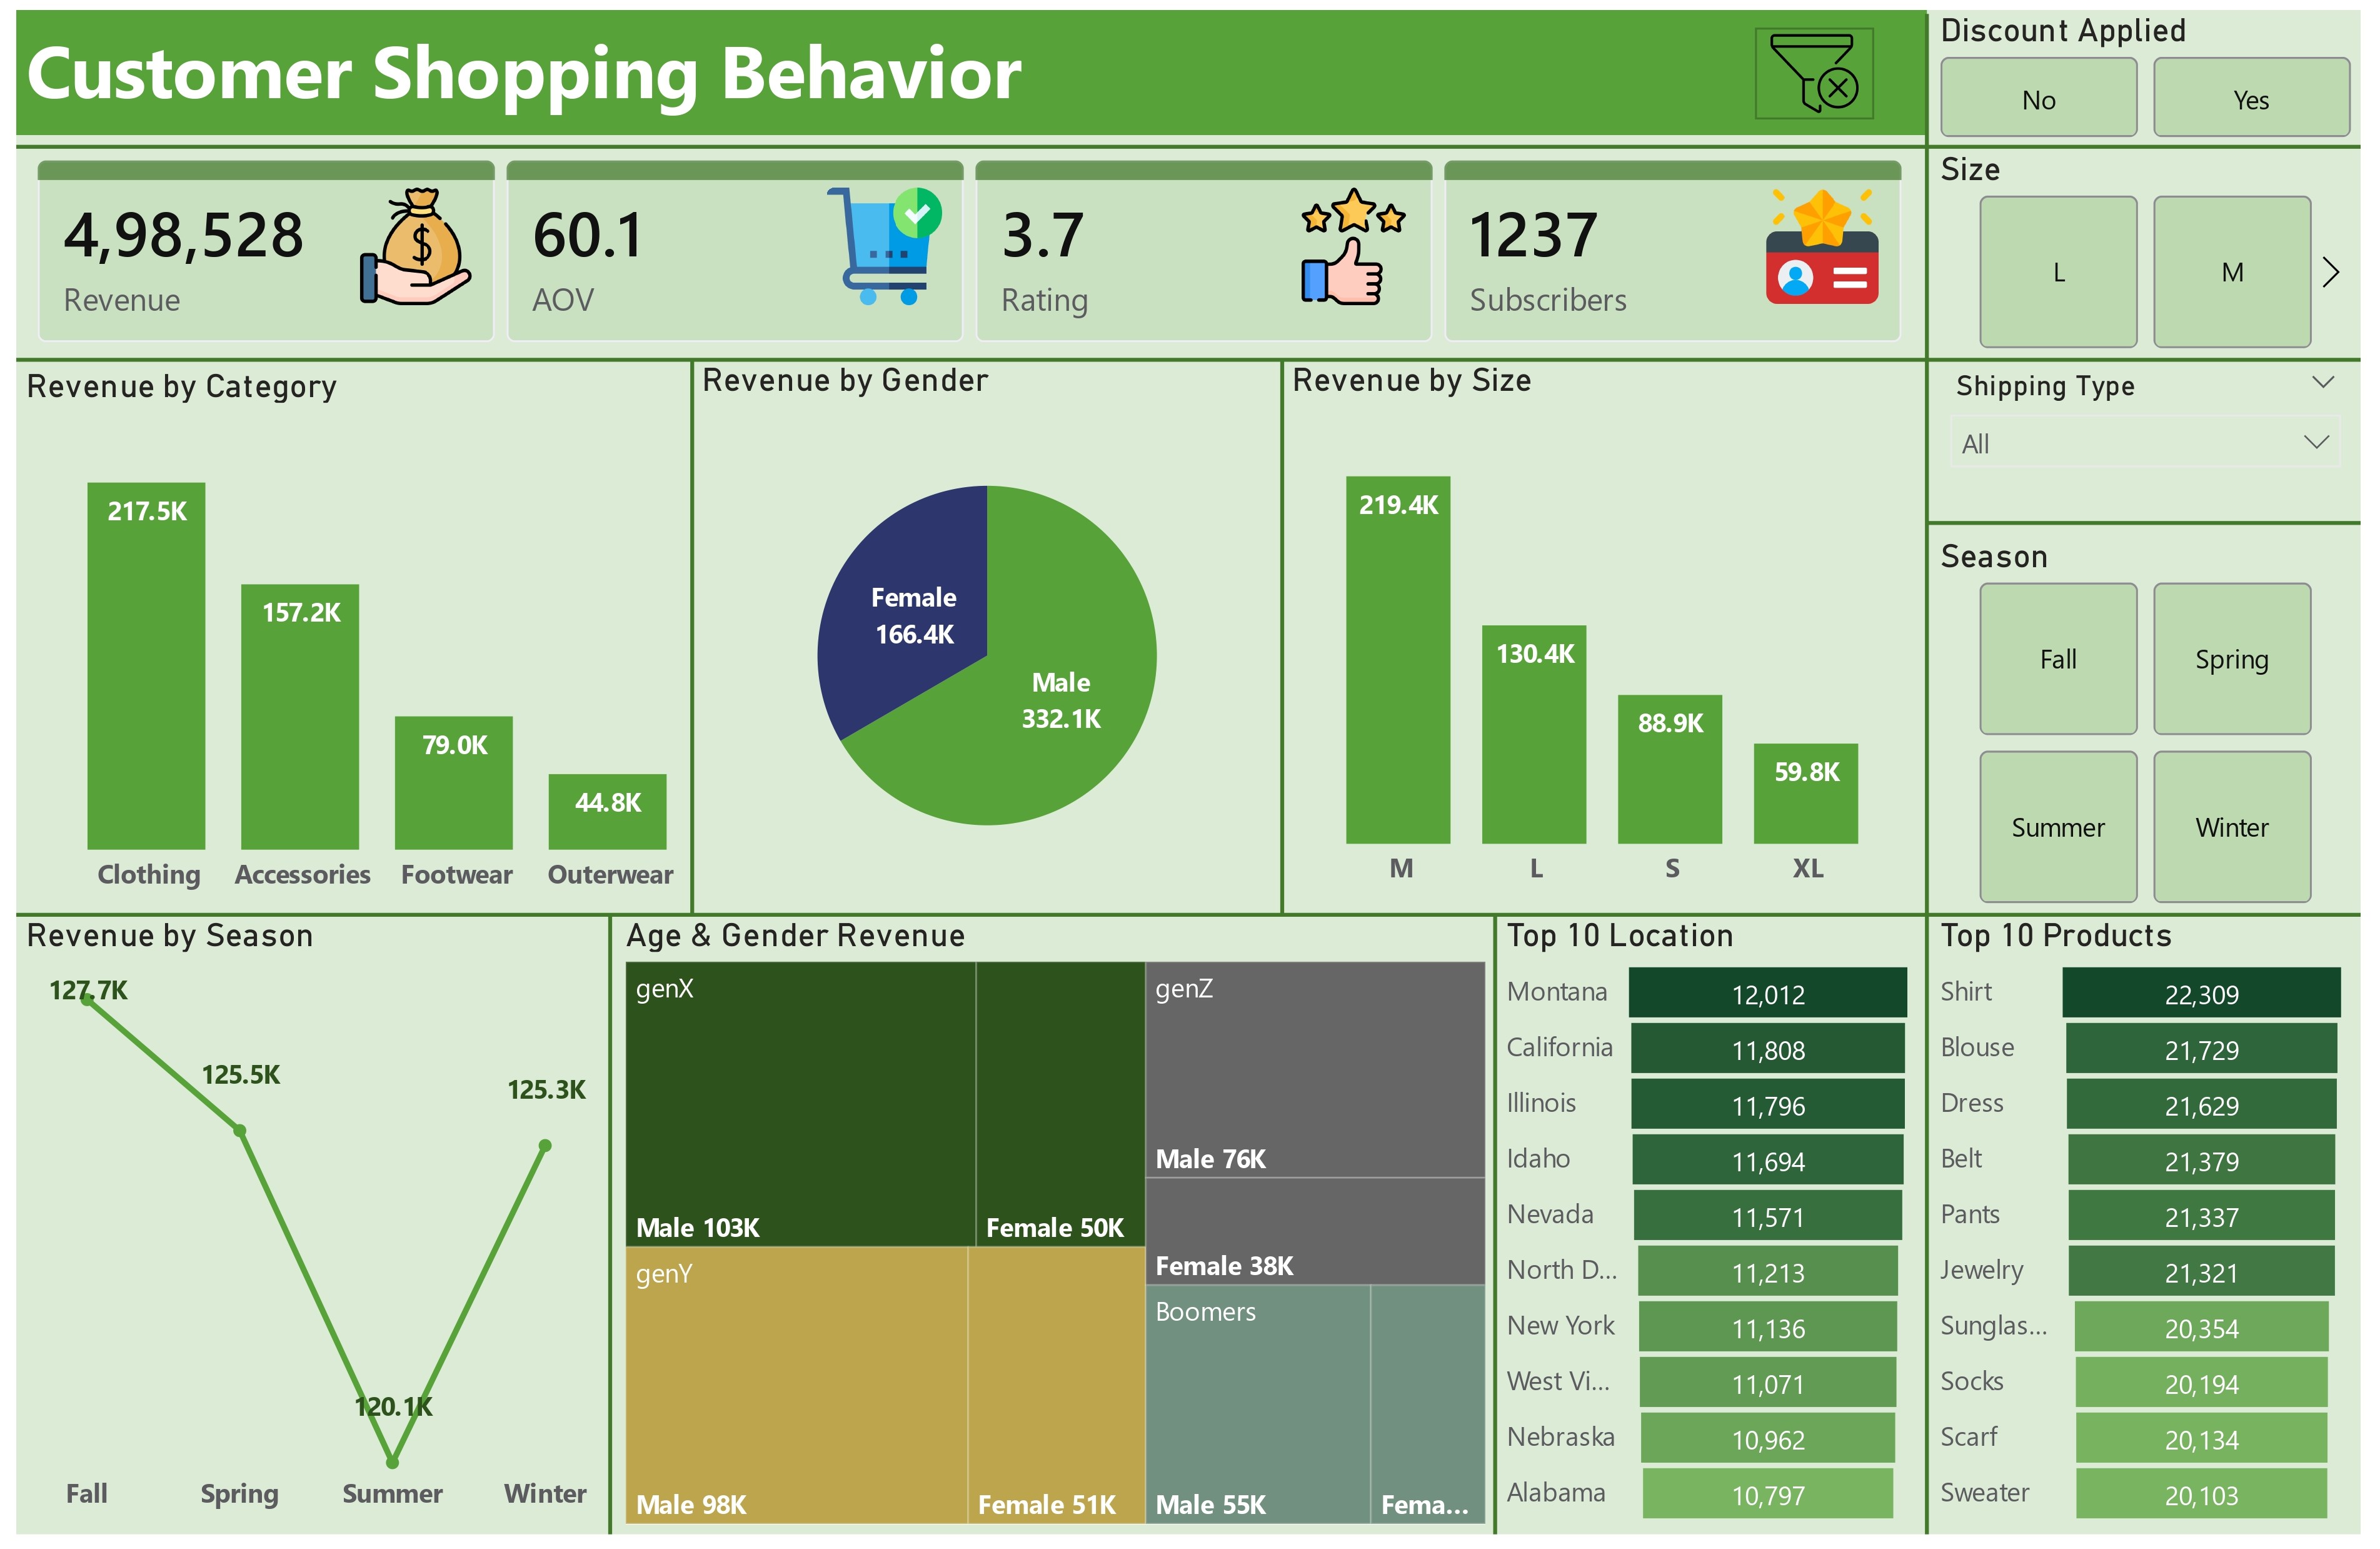
Total Revenue
$498528
AOV
60.1
Avg. Rating
★★★⯪☆
Subscribers
1237
Dashboard Preview